Key takeaways
- Switching from text-heavy layouts to visual cards boosts engagement
- Making content scannable instead of readable reduces reading fatigue
- Displaying trending content visually encourages exploration
- Improved UI elements like content cards trigger curiosity and clicks
- Removing low engagement friction points can increase session duration
Before and After
Why it worked: Switching from reading to browsing increased engagement
Open the leaderboard
Hook
Many SaaS landing pages suffer from low engagement due to overwhelming text and unclear layouts. This is where conversion breaks because visitors quickly lose interest.
Who this is for: Users exploring content quickly will benefit from redesigns that boost engagement through clarity and visual browsing.
In a case study, switching to a visual-focused layout increased Time on page 1.5x, demonstrating the power of clear, scannable content presentation.
Clarity and UI Changes
Why people moved: Users shifted from tiring reading to intuitive browsing, driven by curiosity triggered by visuals.
Action step: Replace dense text with engaging visual cards for headlines and CTAs, and add a trending content UI to invite clicks.
Copy example
Before: Text heavy layout with long paragraphs.
After: Visual cards for quick scanning and interaction.
The before state had a text-heavy headline, dull subheadline, and a weak CTA with no visual proof. After the redesign, content cards and a trending UI were introduced, encouraging users to explore more.
Learn more improvements with LandingBoost.
Scan your page
See real landing page examples
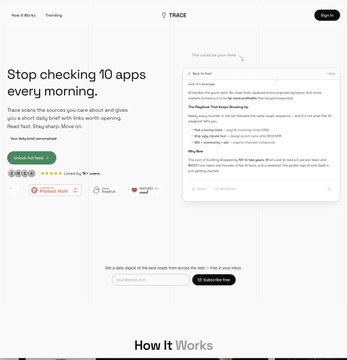
Before state
Action step: Identify and remove elements causing reading fatigue and low engagement.
- Text heavy layout with dense paragraphs
- Content requires reading instead of scanning
- No visible trending content or visual entry points
Copy example
Before: Users forced to read long blocks of text.
After: N/A (context for redesign).
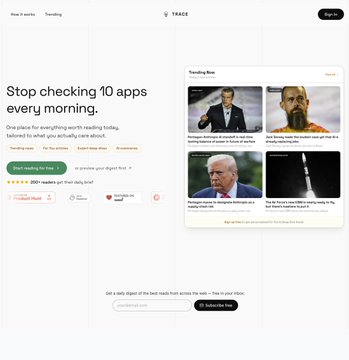
After state
Action step: Implement visual content cards and trending UI to increase curiosity and clicks.
- Visual cards replace text blocks
- Content made scannable, triggering curiosity
- Trending content shown visually to encourage exploration
Copy example
Before: Content hard to scan.
After: Clear cards that invite interaction.
Leaderboard proof
Action step: Use proven UI elements from LandingBoost’s leaderboard examples to enhance engagement and session duration.
This case study’s proof is strong with content cards and a trending UI that visibly show what works.
- Content cards trigger clicks
- Trending UI boosts exploratory behavior
Built with Lovable
I built this blog system and LandingBoost using Lovable to ship fast.
https://landingboost.app/leaderboard/index.html
FAQ
Q: How can visual cards increase engagement?
A: They replace reading fatigue with curiosity by allowing users to browse quickly and interactively.
Q: What UI changes removed friction in the redesign?
A: Removing dense text and adding visual entry points eliminated low engagement and reading fatigue.
Q: Who benefits most from these landing page changes?
A: Users exploring content quickly gain from clearer, scannable layouts that encourage exploration.
Q: Where can I find more examples like this case study?
A: Visit the leaderboard linked above for real landing page examples featuring these best practices.
In conclusion, implementing these changes increased Time on page 1.5x, proving that clear, visual landing pages dramatically boost engagement and conversion.